@sbtools/plugin-depgraph

Plugin that visualizes backend dependency relationships (tables, functions, triggers, policies, views, enums) as an interactive HTML graph and Mermaid diagrams.
Quick Start
bash
npm install @sbtools/plugin-depgraphAdd to config: { "path": "@sbtools/plugin-depgraph" }
bash
# Ensure atlas data exists first
npx sbt generate-atlas

# Generate dependency graphs
npx sbt depgraph
# → docs/dependency-graph.html
# → docs/dependency-graph.md
Commands
| Command | Description |
|---|---|
depgraph | Generate both HTML and Mermaid |
depgraph --html | HTML only |
depgraph --mermaid | Mermaid only |
depgraph --json | Raw JSON output |
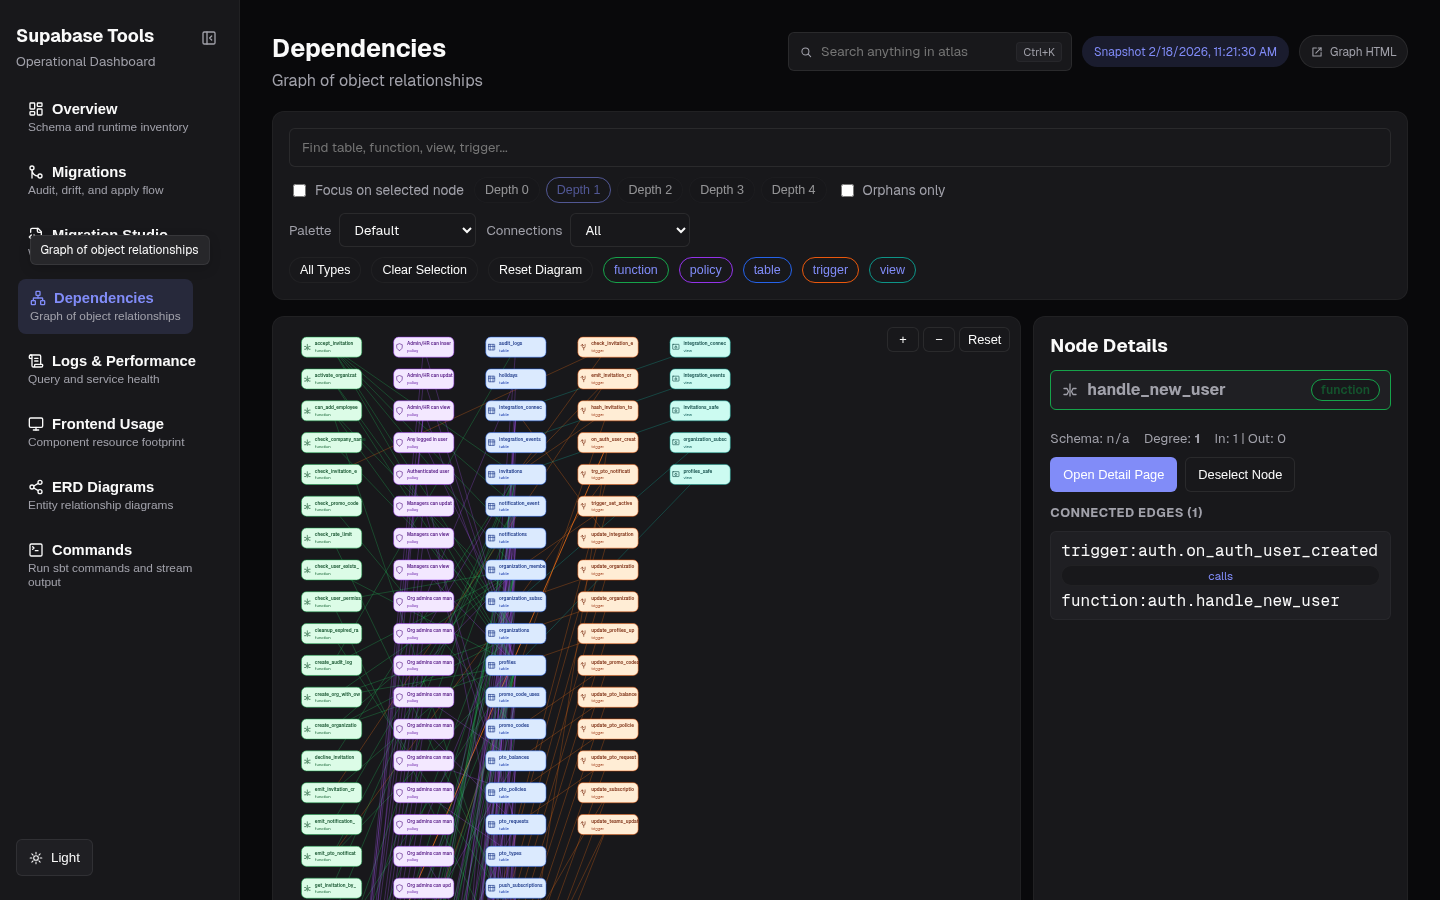 Dependencies page — interactive graph with focus depth, palette presets, and node detail panel
Relationships
Tracks: triggers→tables, policies→tables, functions→tables, views→tables, FK constraints, enum usage.
Dashboard Graph Controls
The dashboard Dependencies page (/depgraph) supports:
- Node focus mode with selectable depth (
0..4) - Palette presets by node type (
Default,Colorblind-safe,High contrast,Muted) - Quick filters: orphan nodes, type multi-select, and connection-count buckets
- Search, pan/zoom, and node detail inspection
Requirements
Run sbt generate-atlas first — plugin reads from docs/backend-atlas-data.json.